Global Operation Management - Forecasting Logistics
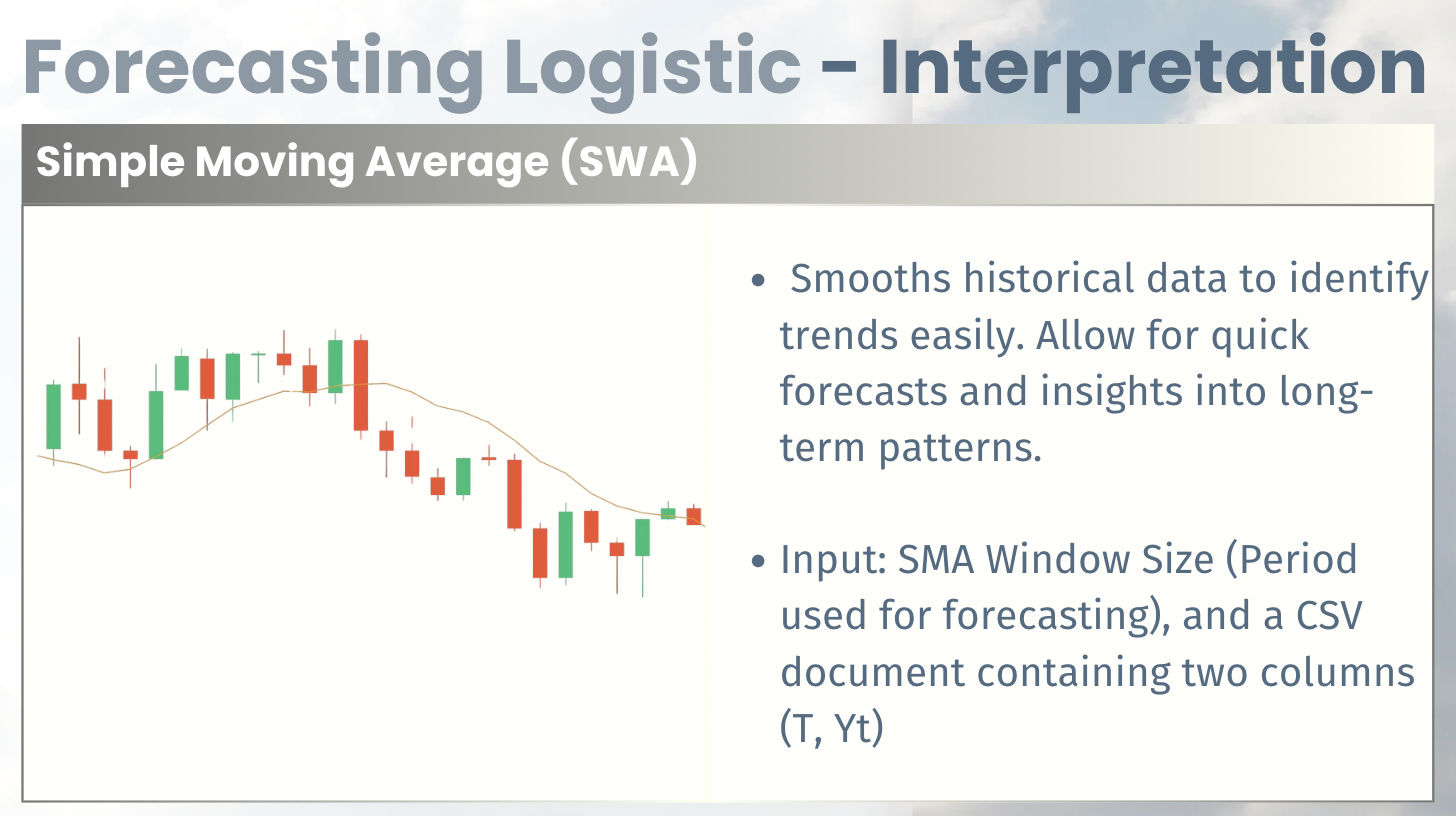
Regular time series - Simple Weighted Average(SWA)
Watch Tutorial
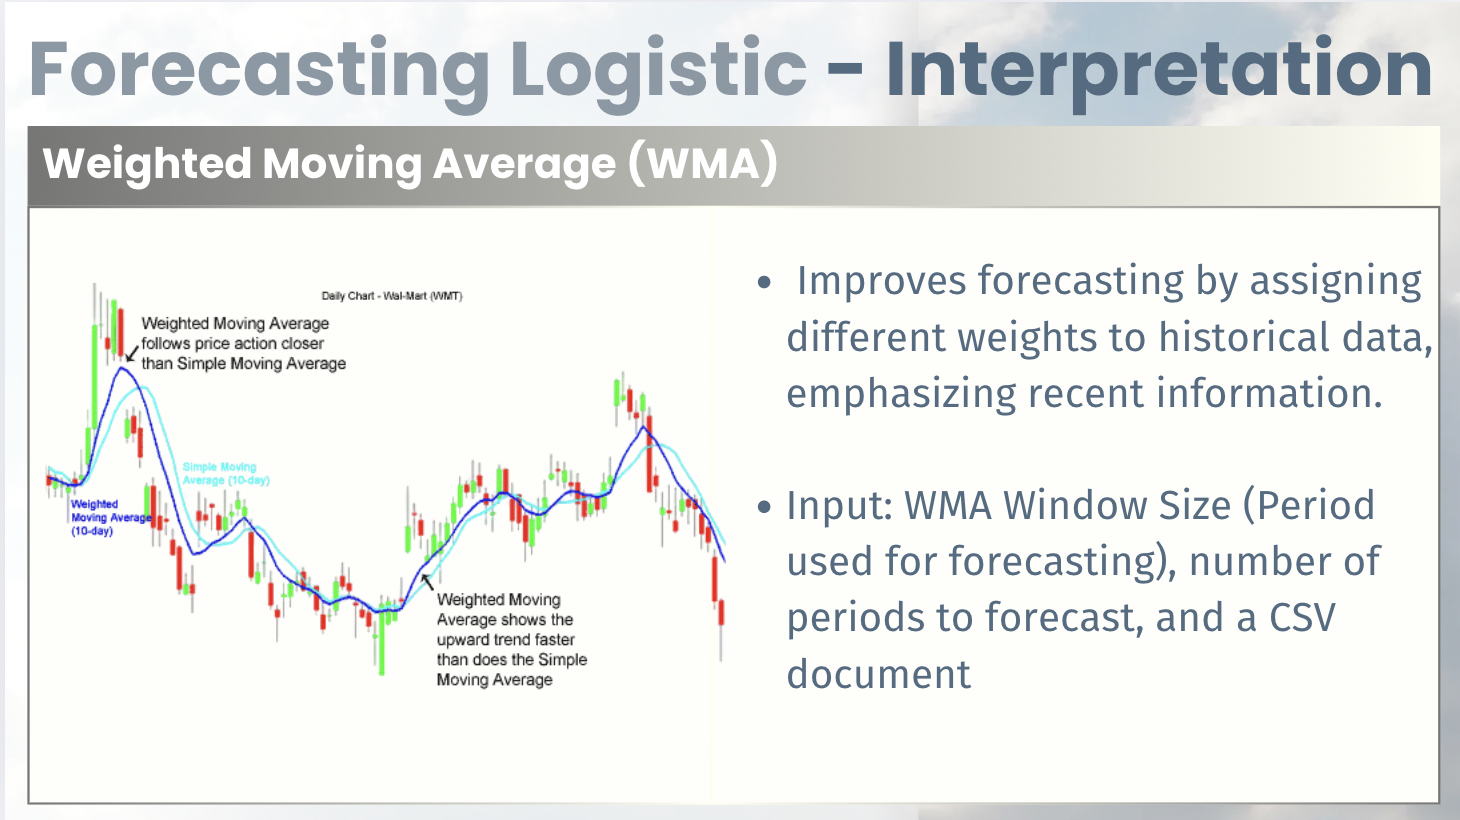
Regular time series - Weighted Moving Average (WMA)
Watch Tutorial
import json
import pandas as pd
def get_plot_string1(data, r, forecast_periods):
result = calculate_wma(data, r)
future_values = predict_future_values_wma(result, r, forecast_periods)
plt = plot_data_wma(result, r, future_values)
buf = io.BytesIO()
plt.savefig(buf, format='png')
plt.close()
buf.seek(0)
string = base64.b64encode(buf.read()).decode('utf-8')
# Output pic
return "data:image/png;base64,"+ string
def on_instant1(event):
try:
window_size = int(Element("C2").element.value)
forecast_periods = int(Element("D2").element.value)
json_str = Element("wma_result").element.innerHTML
if json_str != '':
json_data = json.loads(json_str)
df = pd.DataFrame(json_data)
df['T'] = pd.to_numeric(df['T'], errors='coerce').astype('int64')
df['Yt'] = pd.to_numeric(df['Yt'], errors='coerce').astype('float64')
img_data = get_plot_string1(df, window_size, forecast_periods)
Element("out_instant1").element.innerHTML = "Plt successed."
Element("plot_image1").element.src = img_data
Element("plot_image1").element.style.display = "block"
else:
Element("out_instant1").element.innerHTML = "Please upload csv file."
except ValueError:
Element("out_instant1").element.innerHTML = "Invalid input. Please enter numeric values."
Element("button_instant1").element.onclick = on_instant1
Regular time series - Weighted Moving Average (EMA)
Watch Tutorial
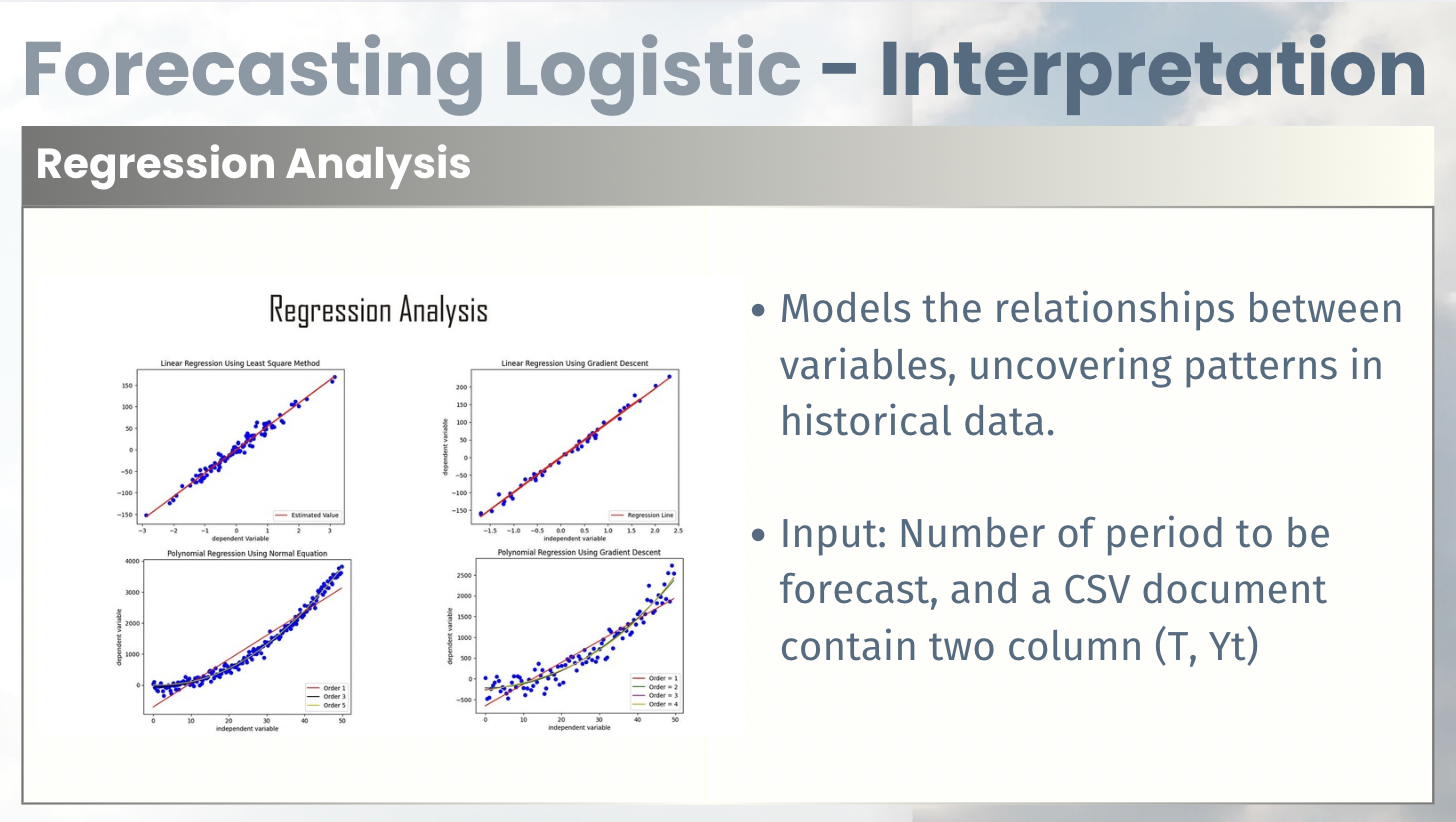
Regular time series - Linear Regression
Watch Tutorial
import json
import pandas as pd
def get_plot_string3(data, predict_number):
a_t, b_t, t, Y = calculate_linear_regression(data)
start_t = int(t[-1]) # last t
predictions = predict_linear(a_t, b_t, start_t, predict_number)
plt = plot_regression_linear(t, Y, a_t, b_t, predictions)
buf = io.BytesIO()
plt.savefig(buf, format='png')
plt.close()
buf.seek(0)
string = base64.b64encode(buf.read()).decode('utf-8')
# output
return "data:image/png;base64,"+ string
def on_instant3(event):
try:
predict_number = int(Element("C4").element.value)
json_str = Element("linear_result").element.innerHTML
if json_str != '':
json_data = json.loads(json_str)
df = pd.DataFrame(json_data)
df['T'] = pd.to_numeric(df['T'], errors='coerce').astype('int64')
df['Yt'] = pd.to_numeric(df['Yt'], errors='coerce').astype('float64')
img_data = get_plot_string3(df, predict_number)
Element("out_instant3").element.innerHTML = "Plt successed."
Element("plot_image3").element.src = img_data
Element("plot_image3").element.style.display = "block"
else:
Element("out_instant3").element.innerHTML = "Please upload csv file."
except ValueError:
Element("out_instant3").element.innerHTML = "Invalid input. Please enter numeric values."
Element("button_instant3").element.onclick = on_instant3
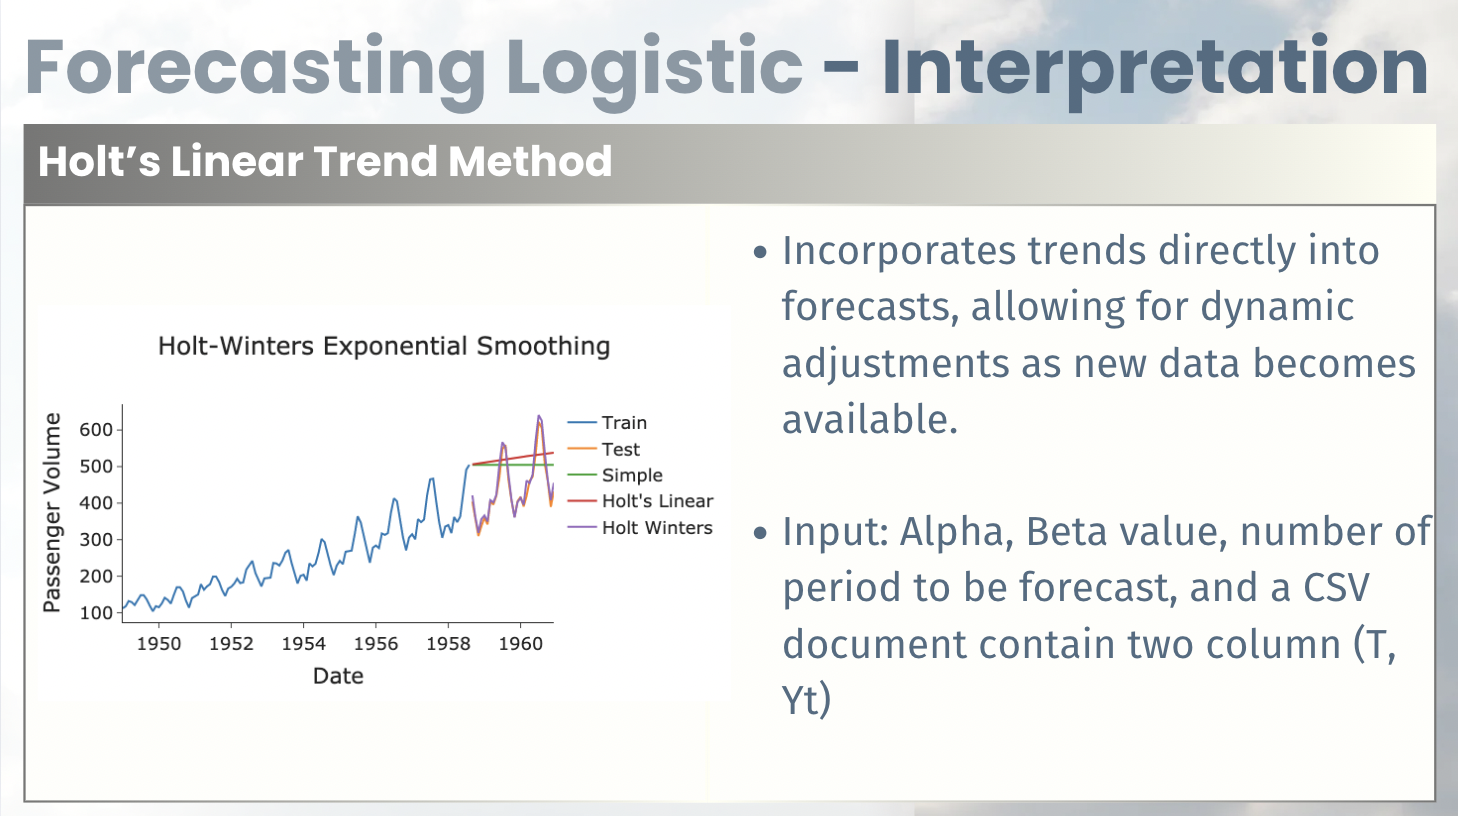
Regular time series - Holt's Linear Exponential Smoothing Model
Watch Tutorial
import json
import pandas as pd
def get_plot_string4(data, alpha, beta, num_forecasts):
Y = data['Yt'].values
a, b, P = holt_linear_exponential_smoothing(Y, alpha, beta)
last_a = a[-1]
last_b = b[-1]
# Forecast future values
future_forecasts = forecast_future_values_holt(
last_a, last_b, num_forecasts)
plt = plot_results_holt(Y, a, P, future_forecasts, num_forecasts)
buf = io.BytesIO()
plt.savefig(buf, format='png')
plt.close()
buf.seek(0)
string = base64.b64encode(buf.read()).decode('utf-8')
# output
return "data:image/png;base64,"+ string
def on_instant2(event):
try:
alpha = float(Element("C5").element.value)
beta = float(Element("D5").element.value)
num_forecasts = int(Element("E5").element.value)
if not (0 < alpha < 1):
raise ValueError("Alpha must be between 0 and 1.")
if not (0 < beta < 1):
raise ValueError("Beta must be between 0 and 1.")
json_str=Element("hot_result").element.innerHTML
if json_str !='' :
json_data=json.loads(json_str)
df=pd.DataFrame(json_data)
df['T']=pd.to_numeric(df['T'], errors='coerce' ).astype('int64')
df['Yt']=pd.to_numeric(df['Yt'], errors='coerce' ).astype('float64')
img_data=get_plot_string4(df, alpha, beta, num_forecasts)
Element("out_instant4").element.innerHTML="Plt successed."
Element("plot_image4").element.src=img_data
Element("plot_image4").element.style.display="block"
else:
Element("out_instant4").element.innerHTML="Please upload csv file."
except ValueError:
Element("out_instant4").element.innerHTML="Invalid input. Please enter numeric values."
Element("button_instant4").element.onclick=on_instant2
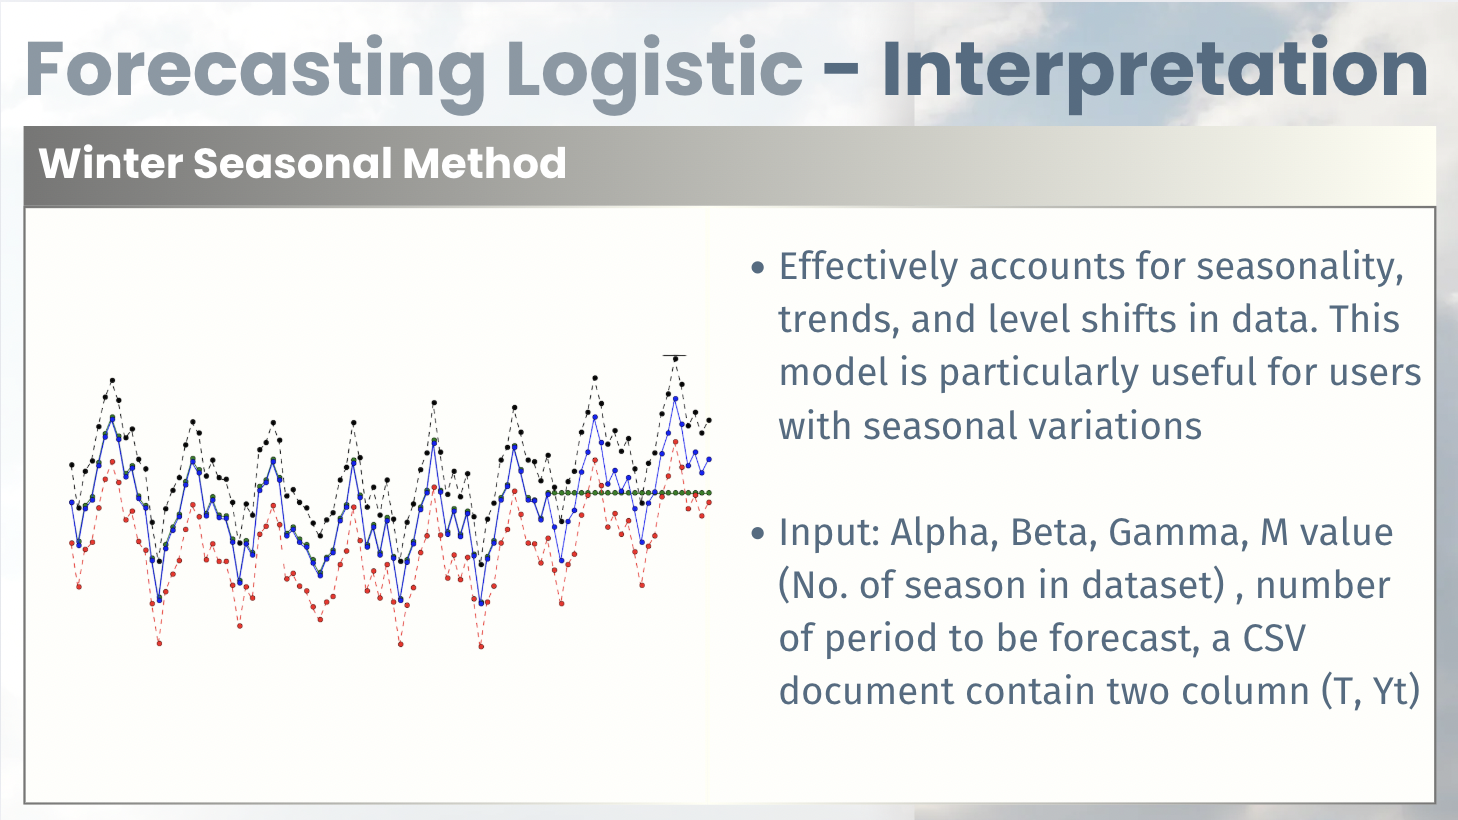
Regular time series - Winter Seasonal Forecasting Model
Watch Tutorial
import json
import pandas as pd
def get_plot_string5(data, alpha, beta, gamma, M, n_forecasts):
Yt = data['Yt']
# Calculate A, B, S
A, B, S = calculate_ABC(Yt, alpha, beta, gamma, M)
group_size = len(Yt) // M
forecasts = forecast_seasons(A, B, S, n_forecasts, group_size)
# Graph part
forecast_df = pd.DataFrame({
'Time Period': range(len(Yt) + 1, len(Yt) + len(forecasts) + 1),
'Forecast': forecasts
})
plt.figure(figsize=(12, 6))
plt.plot(range(1, len(Yt) + 1), Yt, label='Original Data')
plt.plot(
forecast_df['Time Period'],
forecast_df['Forecast'],
label='Forecasted Data',
linestyle='--')
plt.xlabel('Time Period')
plt.ylabel('Values')
plt.title('Seasonal Forecasting')
plt.legend()
buf = io.BytesIO()
plt.savefig(buf, format='png')
plt.close()
buf.seek(0)
string = base64.b64encode(buf.read()).decode('utf-8')
# Output
return "data:image/png;base64,"+ string
def on_instant5(event):
try:
alpha = float(Element("C6").element.value)
beta = float(Element("D6").element.value)
gamma = float(Element("E6").element.value)
M = int(Element("F6").element.value)
n_forecasts = int(Element("G6").element.value)
if not (0 < alpha < 1):
raise ValueError("Alpha must be between 0 and 1.")
if not (0 < beta < 1):
raise ValueError("Beta must be between 0 and 1.")
if not (0 < gamma < 1):
raise ValueError("Gamma must be between 0 and 1.")
json_str = Element("winter_result").element.innerHTML
if json_str != '':
json_data = json.loads(json_str)
df = pd.DataFrame(json_data)
df['T'] = pd.to_numeric(df['T'], errors='coerce').astype('int64')
df['Yt'] = pd.to_numeric(df['Yt'], errors='coerce').astype('float64')
img_data = get_plot_string5(df, alpha, beta, gamma, M, n_forecasts)
Element("out_instant5").element.innerHTML = "Plt successed."
Element("plot_image5").element.src = img_data
Element("plot_image5").element.style.display = "block"
else:
Element("out_instant5").element.innerHTML = "Please upload csv file."
except ValueError:
Element("out_instant5").element.innerHTML = "Invalid input. Please enter numeric values."
Element("button_instant5").element.onclick = on_instant5